Company and local economic intelligence
CHART is Whitestone Analytics' proprietary software platform for viewing and exploring business and place intelligence.
It brings together company records, local business signals, sector context and analytical workflows to help teams understand where to focus, what is changing and which firms matter.
CHART modules
Explore each CHART capability in detail.
See the pattern. Find the evidence. Decide with confidence.
CHART supports the analytical workflow behind place intelligence, business targeting and deeper company understanding.
See the pattern
Explore sector strengths, company movement, local business composition and change over time.
Find the evidence
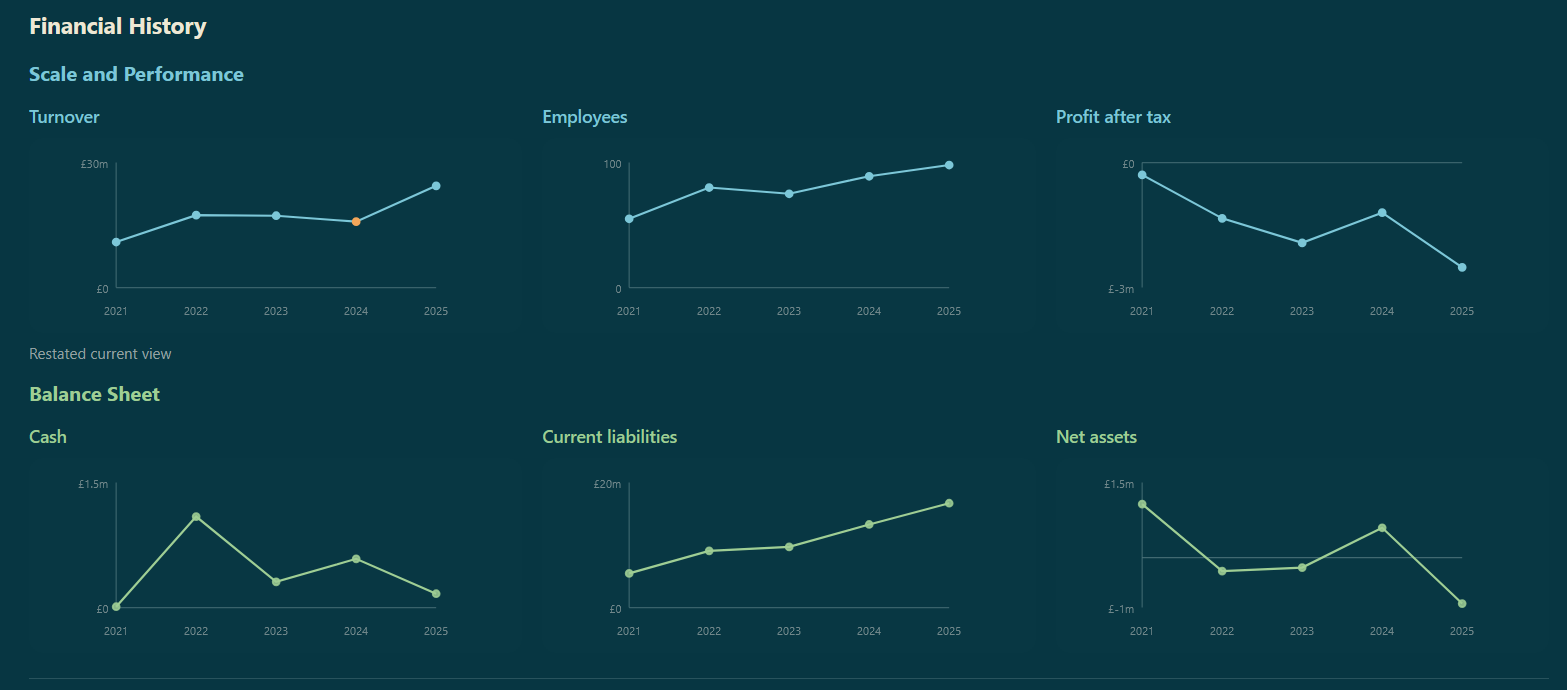
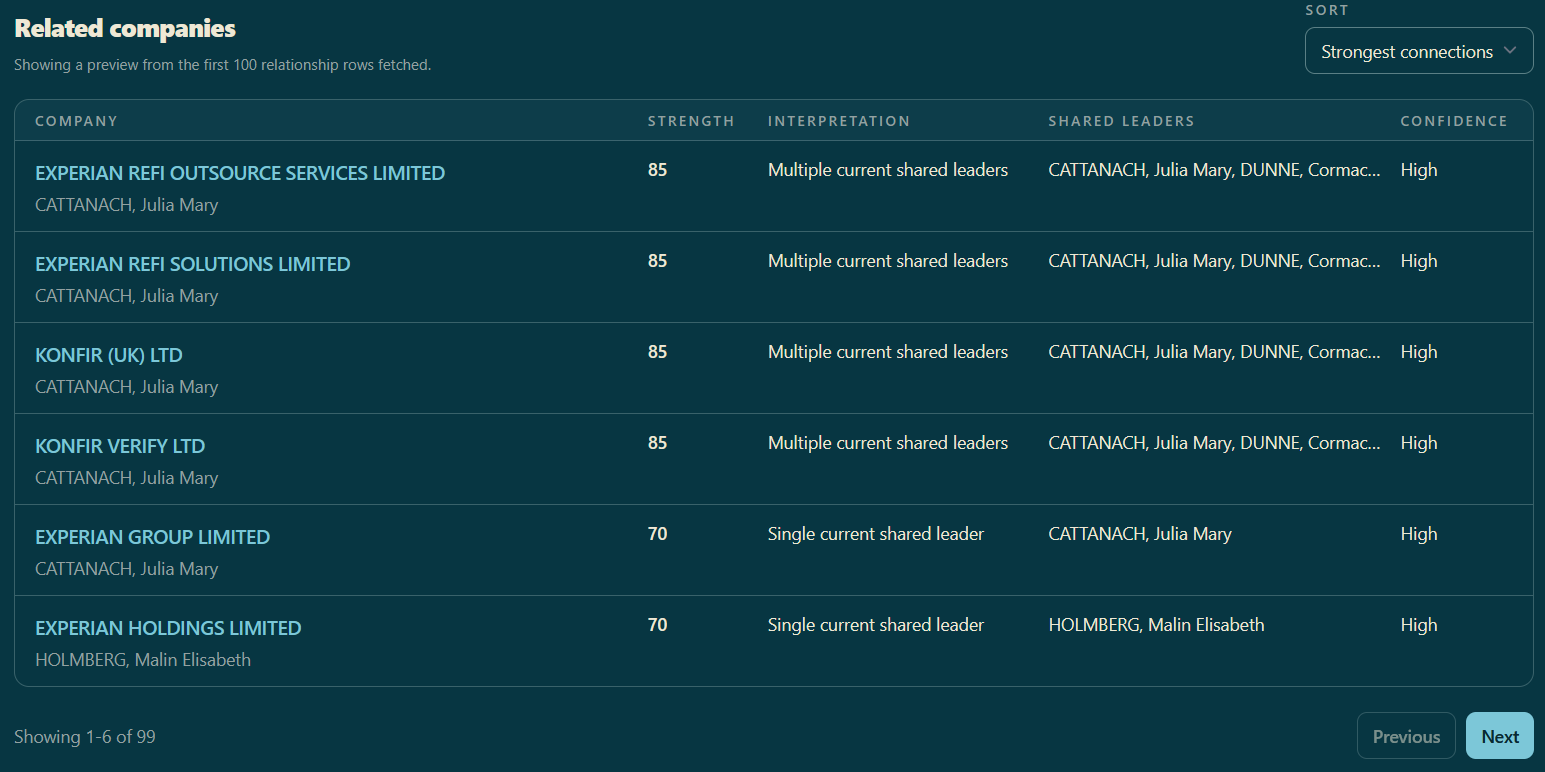
Review company profiles, governance context, geography, innovation signals and financial indicators.
Take action
Build lists, prioritise engagement and support research, policy and programme decisions.
Built for local economic decisions
CHART supports the recurring decisions faced by local authorities, universities and economic development teams: where to focus, which firms to engage, what is changing, and where the evidence sits.
Place intelligence
Understand local business populations, sector composition, startups, dissolutions, growth signals, innovation-linked companies and change over time.
Targeting and engagement
Build priority company lists for business support, inward investment, skills engagement, consultations, boards and account planning.
Movement and change
Explore registered-office movement into, out of and within places, including movement by sector, geography and company characteristics.
Innovation ecosystems
Analyse high-growth firms, R&D-active companies, spinouts, project links, provider relationships and sector strengths.
Company intelligence
Financial, governance and relationship evidence in context.
In addition to place and engagement workflows, CHART supports deeper company intelligence using financial history, governance records and related-company views.